Originally Posted on August 22, 2018 by hsauro
Let’s say we have a chemical network model where the species oscillate and you’d like to plot every combination of these on a grid. If so, then this code might be of help.
1 2 3 4 5 6 7 8 9 10 11 12 13 14 15 16 17 18 19 20 21 22 23 24 25 26 27 28 29 30 31 32 33 34 35 36 | import tellurium as te import roadrunner import pylab as plt import tellurium as te r = te.loada (''' model feedback() // Reactions: J0: $X0 -> S1; (VM1 * (X0 - S1/Keq1))/(1 + X0 + S1 + S4^h); J1: S1 -> S2; (10 * S1 - 2 * S2) / (1 + S1 + S2); J2: S2 -> S3; (10 * S2 - 2 * S3) / (1 + S2 + S3); J3: S3 -> S4; (10 * S3 - 2 * S4) / (1 + S3 + S4); J4: S4 -> $X1; (V4 * S4) / (KS4 + S4); // Species initializations: S1 = 0; S2 = 0; S3 = 0; S4 = 0; X0 = 10; X1 = 0; // Variable initialization: VM1 = 10; Keq1 = 10; h = 10; V4 = 2.5; KS4 = 0.5; end''') slist = r.getFloatingSpeciesIds() fig = plt.figure(figsize=(9,6)) fig.tight_layout() r.reset() m = r.simulate (0, 80, 2000, slist) count = 0 for i in range(4): for j in range(4): count += 1 if i >= j: ax = fig.add_subplot(4, 4, count) ax.set_xlabel (slist[i]) ax.set_ylabel (slist[j]) ax.plot (m[:,i], m[:,j]) |
This code will generate:
Here is an alternative that has removed the internal ticks and labels and arranges the column and row labels as contiguous. This is probably more than one might expect. This version plots all combinations including the transpose combinations.
1 2 3 4 5 6 7 8 9 10 11 12 13 14 15 16 17 18 19 20 21 22 23 24 25 26 27 28 29 30 31 32 33 34 35 36 37 38 39 40 41 42 43 44 45 46 47 48 49 50 51 52 | import tellurium as te import roadrunner import pylab as plt import tellurium as te r = te.loada (''' model feedback() // Reactions: J0: $X0 -> S1; (VM1 * (X0 - S1/Keq1))/(1 + X0 + S1 + S4^h); J1: S1 -> S2; (10 * S1 - 2 * S2) / (1 + S1 + S2); J2: S2 -> S3; (10 * S2 - 2 * S3) / (1 + S2 + S3); J3: S3 -> S4; (10 * S3 - 2 * S4) / (1 + S3 + S4); J4: S4 -> $X1; (V4 * S4) / (KS4 + S4); // Species initializations: S1 = 0; S2 = 0; S3 = 0; S4 = 0; X0 = 10; X1 = 0; // Variable initialization: VM1 = 10; Keq1 = 10; h = 10; V4 = 2.5; KS4 = 0.5; end''') count = 0 slist = sorted (r.getFloatingSpeciesIds()) m = r.simulate (0, 80, 2000, slist) fig, axarr = plt.subplots(4,4,figsize=(9,6)) fig.subplots_adjust (wspace=0.0, hspace=0.0) for i in range(4): for j in range(4): count += 1 ax = plt.subplot2grid ((4,4),(i,j)) if i==3: ax.set_xlabel (slist[j]) else: ax.set_xticklabels([]) ax.set_xticks([]) if j == 0: ax.set_ylabel (slist[i]) else: ax.set_yticklabels([]) ax.set_yticks([]) ax.plot (m[:,i], m[:,j]) # Comment the above line and uncomment these lines # to only plot the lower half of the grid #if count in [2,3,4,7,8,12]: # ax.set_visible(False) #else: # ax.plot (m[:,i], m[:,j]) |
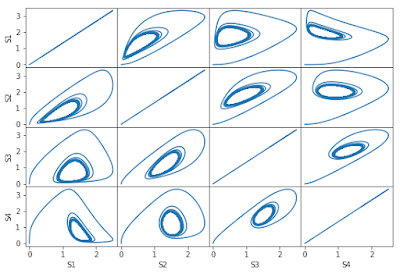
The following shows the steady-state oscillations. This was done by simulating the model twice and using the plotting the second set of simulation results.


No comments:
Post a Comment