Last year I did a short blog on simulating the smallest chemical network that could display Hopf bifurcation oscillations. Here I want to revisit this with an eye to explain why it oscillates. The paper in question is
Wilhelm, Thomas, and Reinhart Heinrich. “Smallest chemical reaction system with Hopf bifurcation.” Journal of mathematical chemistry 17.1 (1995): 1-14.
In the blog I showed the figure that was given in the paper which was:
The question is how does this network generate oscillations? In order to answer this question, we must first redraw the network. I’m going to make two changes to the figure.
You’ll notice that the reaction X + Y -> Y consumes and regenerates Y so that Y doesn’t actually change in concentration as a result of this reaction. Instead, we can treat Y as an activator of the reaction. In the paper the rate law for this reaction was k*X*Y, we leave this as is but change the reaction to X -> waste. This won’t alter the dynamics at all but we can reinterpret this reaction as something activated by Y without consuming Y
For the reaction X + Y -> Y, we can write the equivalent form
X -> waste; activated by Y: v = k*X*Y
The other interesting reaction is X + A -> X + X. This is what is called an auto-catalytic reaction, that is X stimulates its own production and this is key to the origins of the oscillations In the diagram, we can replace this in the diagram with X activating itself, in other words, a positive feedback loop. This reaction on its own has one steady state when X is zero. If X is not zero, the concentration of X tends to infinity at infinite time.
With these changes, we’ll redraw the network in the following way with the reaction numbers staying the same as those found in the original figure:
In the new drawing, we can see a positive feedback loop in blue formed from the X -> X + X reaction and a delayed negative feedback loop in red that goes from X to reaction 2 via reactions 4 and 5. The negative feedback loop is negative with respect to X because increases in X will result in activation of reaction 2 resulting in a higher degradation rate of X. This is the classic structure for a relaxation oscillator, a positive feedback coupled with a negative feedback loop that causes X to turn on and off repeatedly. Let’s make a smaller version of the positive feedback unit using reactions 1, 2, and 4:
X -> X + X; k1*X
X -> Ao; k2*Y*X
X -> Z; k4*X
The rate of change of X is given by:
dx/dt = k1 X – k2 X Y – k4 X
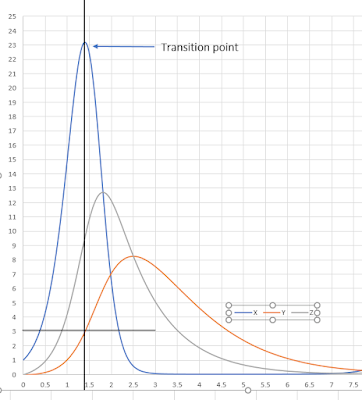
We can see that the rate of change of X can be positive or negative depending on the value for Y and X. At low Y, the rate of change of X will be positive but at high enough Y, the rate of change will turn negative. In other words, the system can be switched from an unstable to a stable regime by setting Y. If we set k2 = 1 and k4 = 1 then the cross over point from unstable to stable is when Y = k1 – 1. In the model k1 = 4, therefore the rate of change of X will switch stability when the level of Y is 3. See the time course plot below.
When X and Y are small the network is in an unstable state and X rises, this causes Y to rise but with a delay due to having to go through Z. However once Y reaches a threshold dictated by k1, k2, and k4, the rate of change of X goes negative and the system enters a stable regime. As X drops, so does Y which means the threshold is passed again but in the opposite direction and the system switches from a stable to an unstable regime. This loop continues indefinitely resulting in oscillations.


No comments:
Post a Comment